My Blog

Project Part 2
Interactive and static plots of United States deaths per drug from 1990 to 2015.
Project Part 1
Preparing the "Deaths from Substance Disorders" data for plotting.
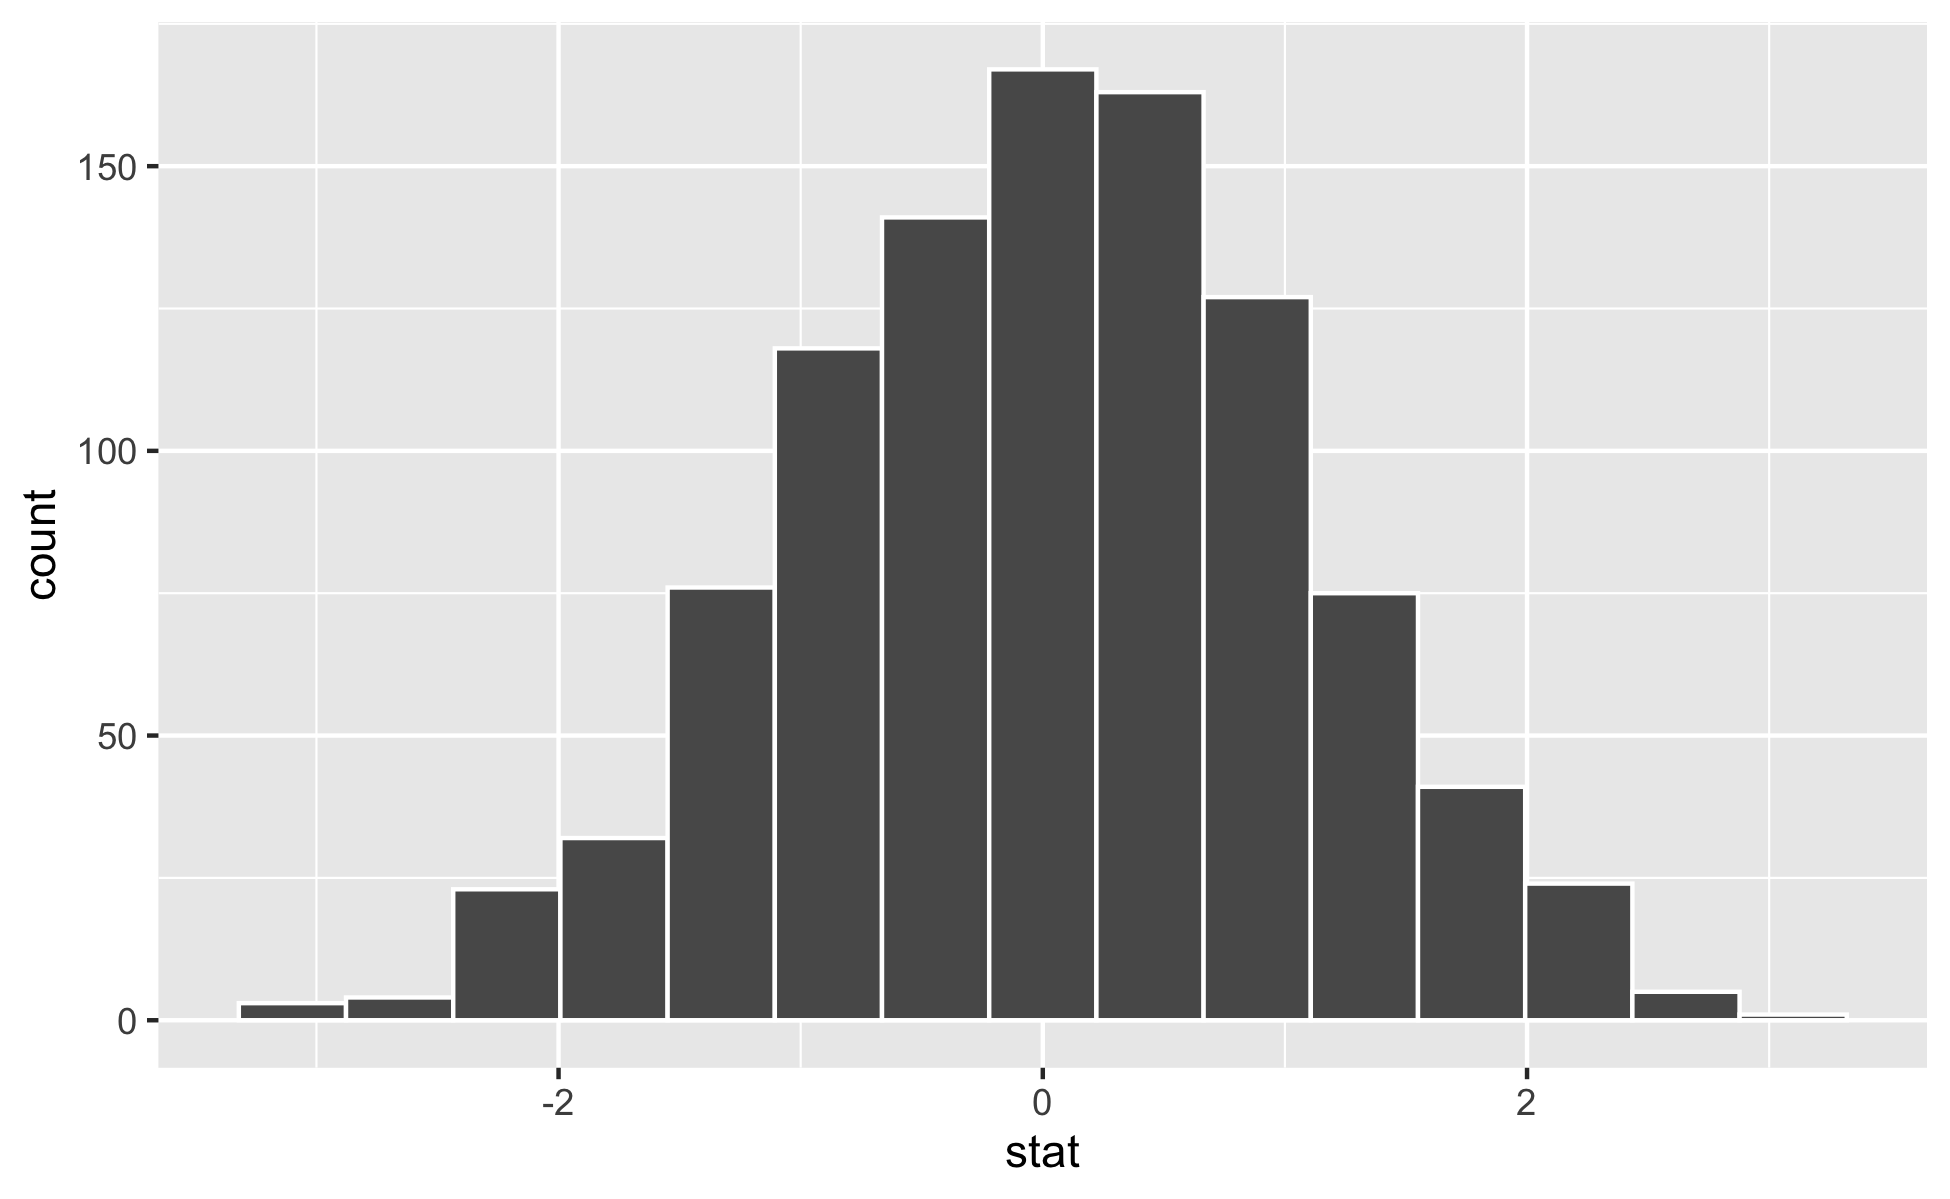
Hypothesis Testing
Using computer simulation. Based on examples from the `infer` package. Code for Quiz 13
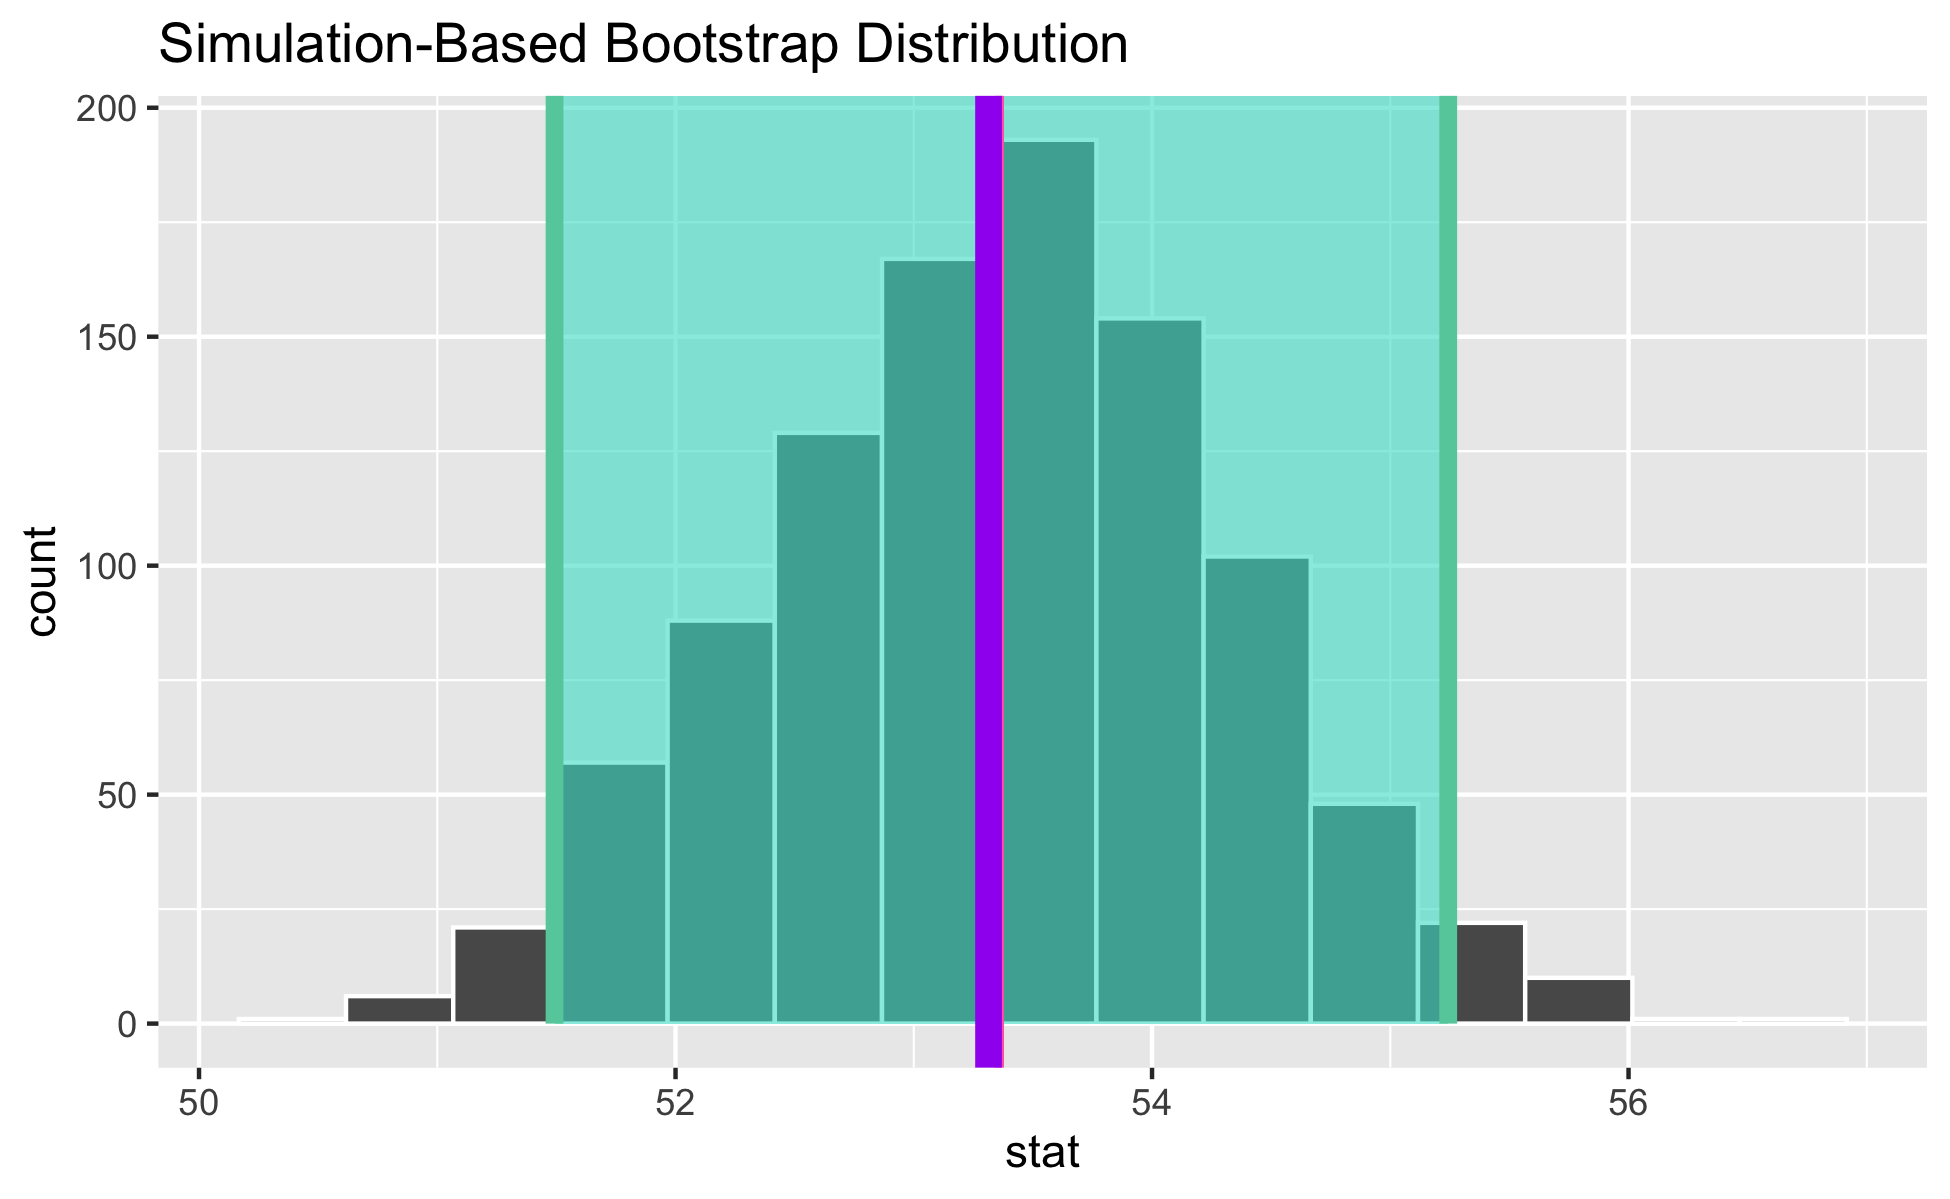
Bootstrapping
Based on Chapter 8 of ModernDive. Code for Quiz 12.
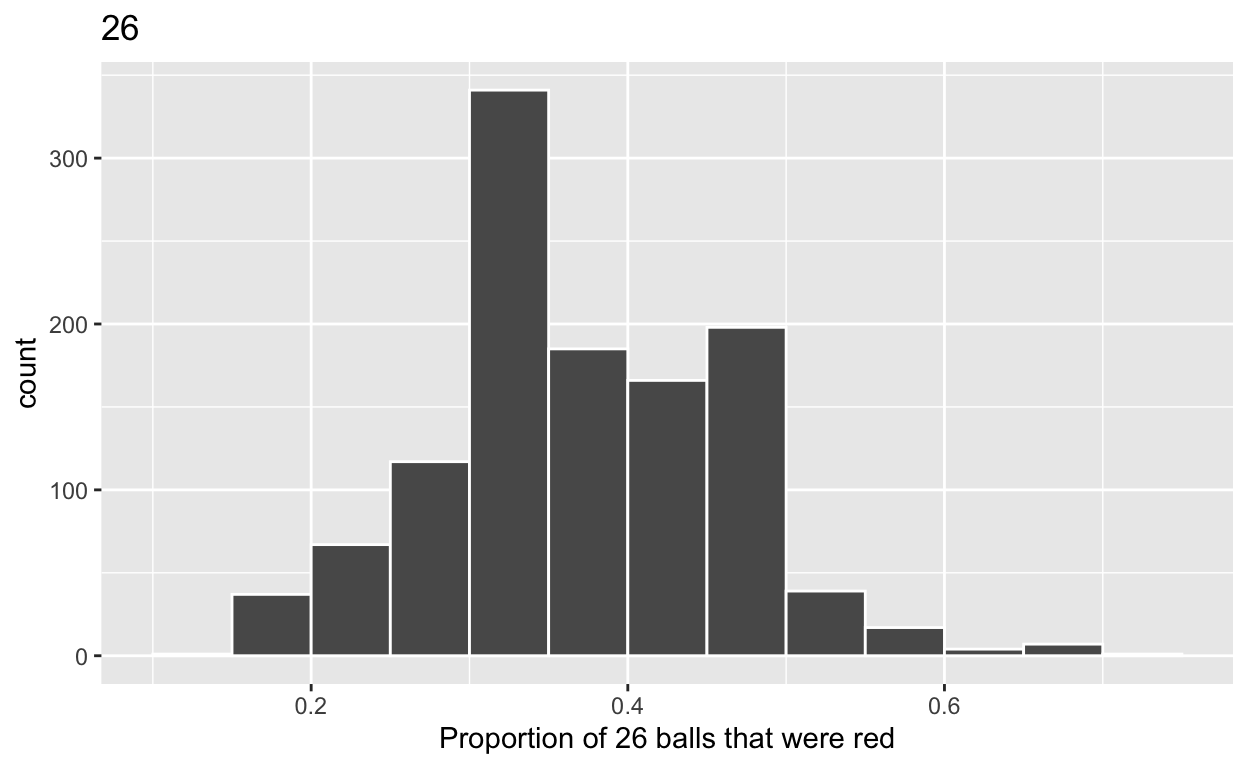
Sampling
Based on Chapter 7 of ModernDive. Code for Quiz 11.
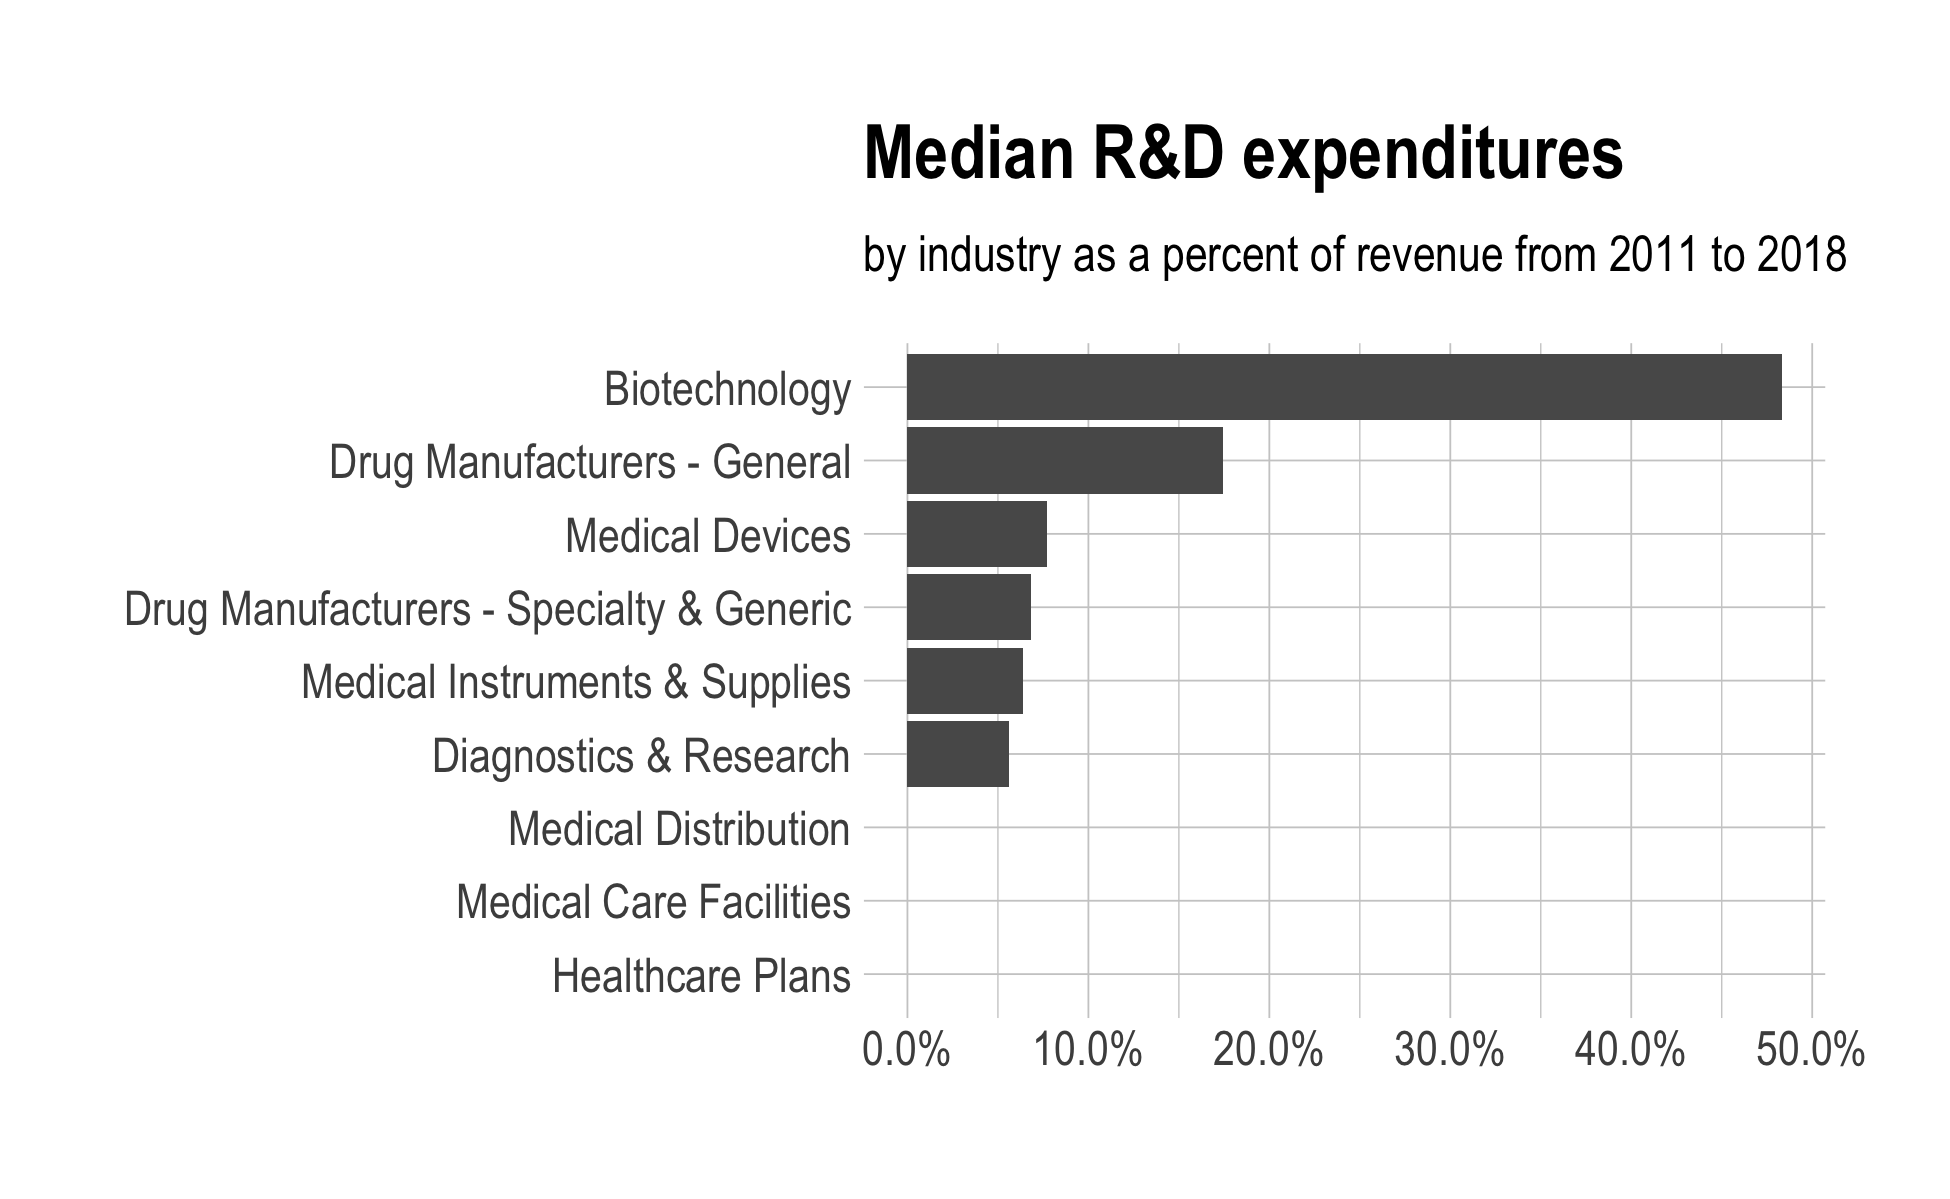
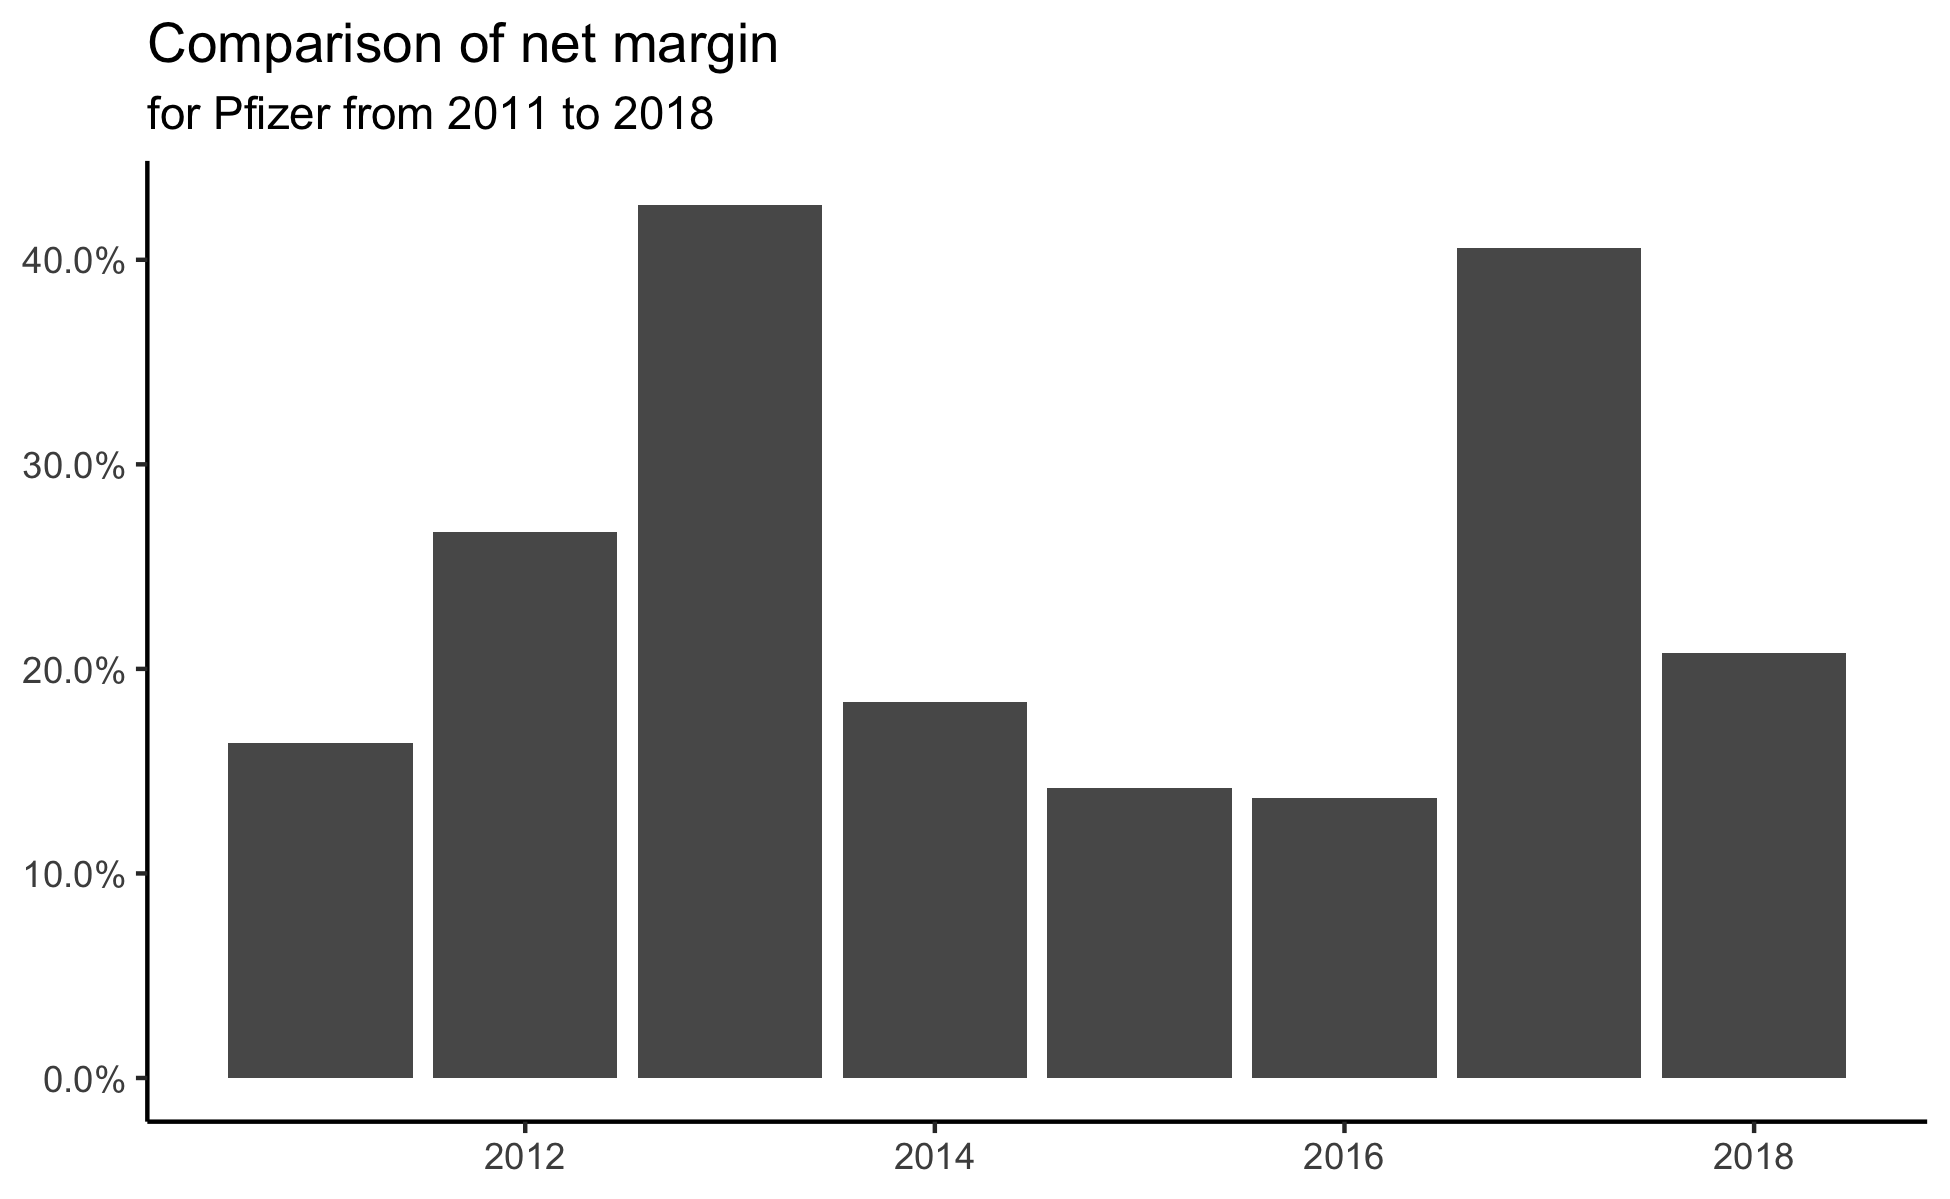
Data Visualization
Code for Quiz 9.
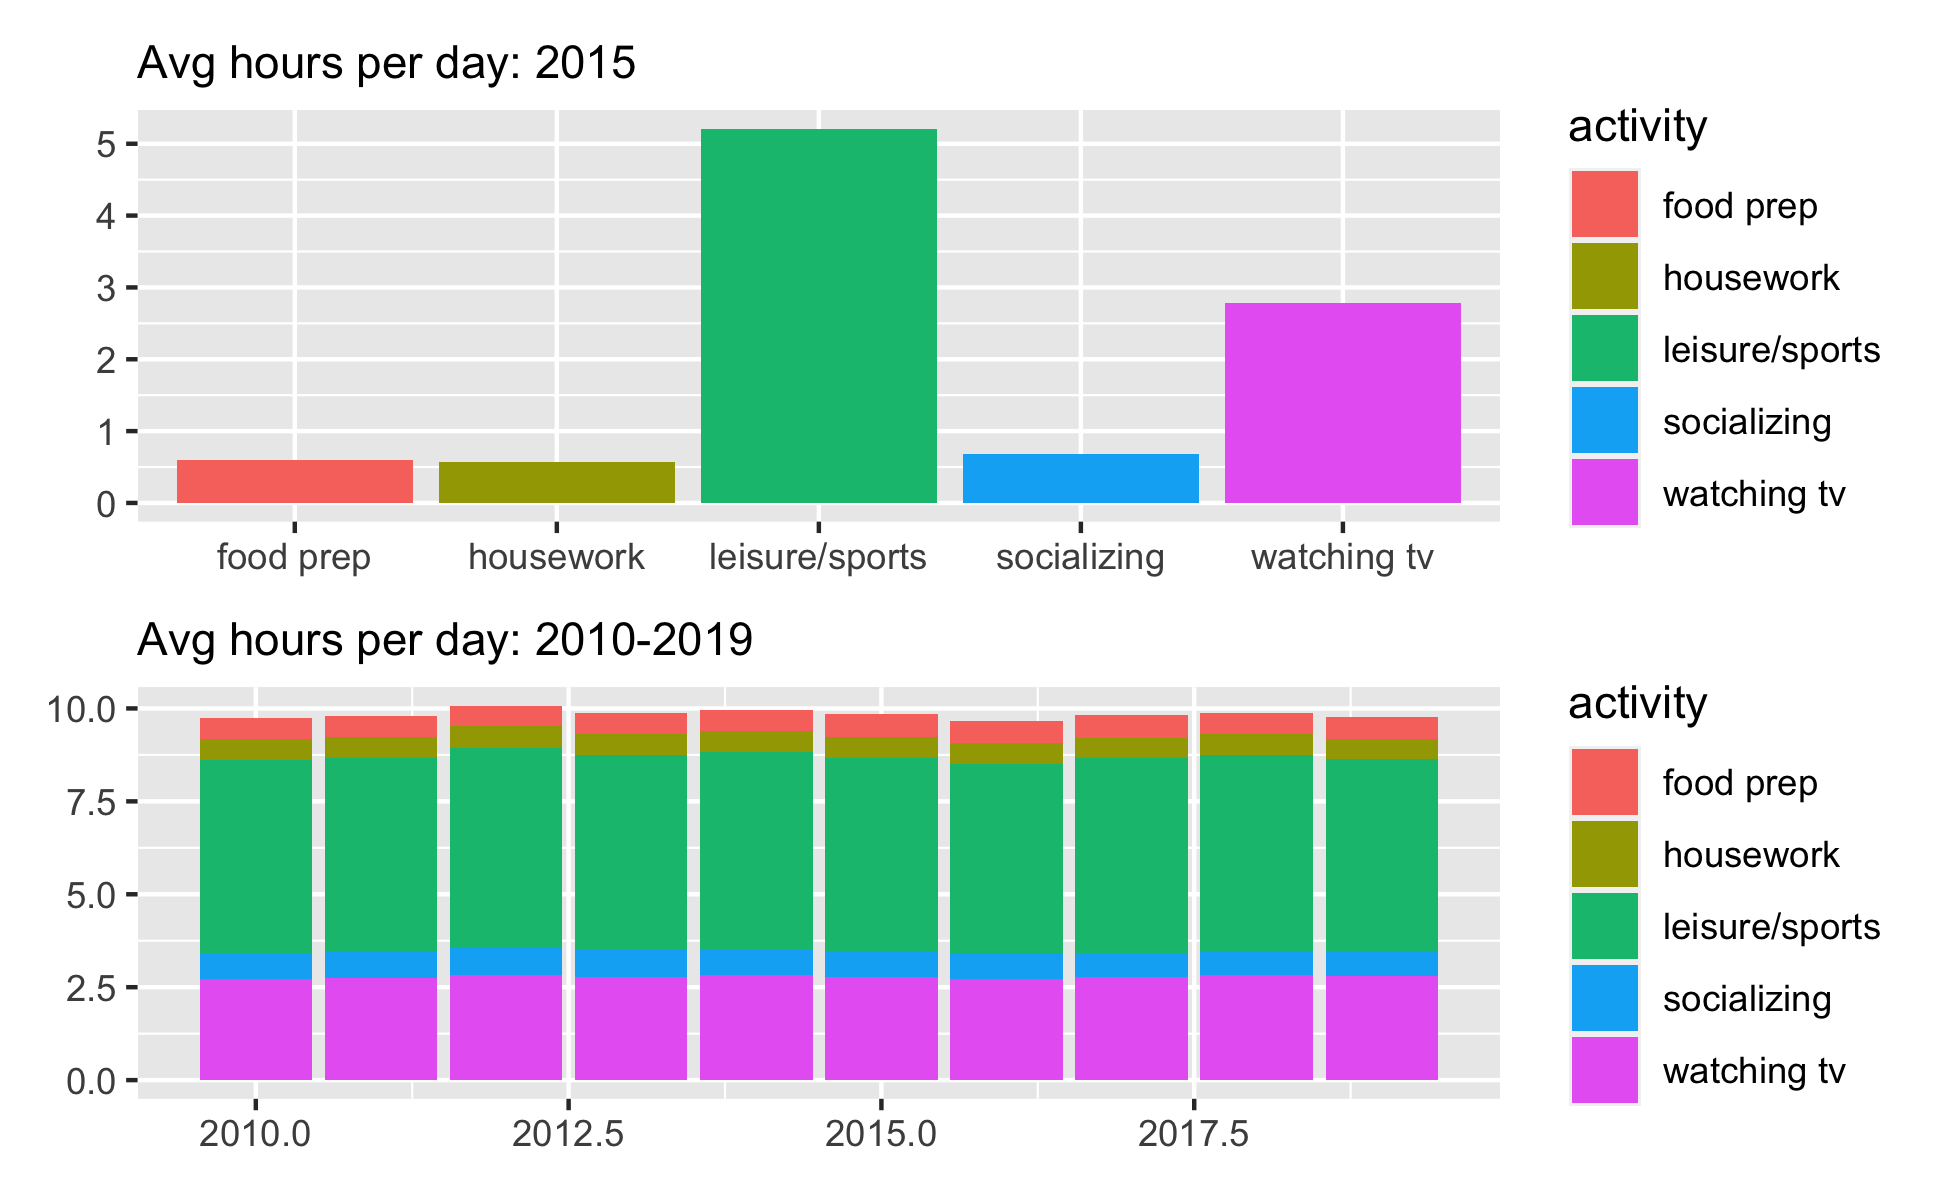
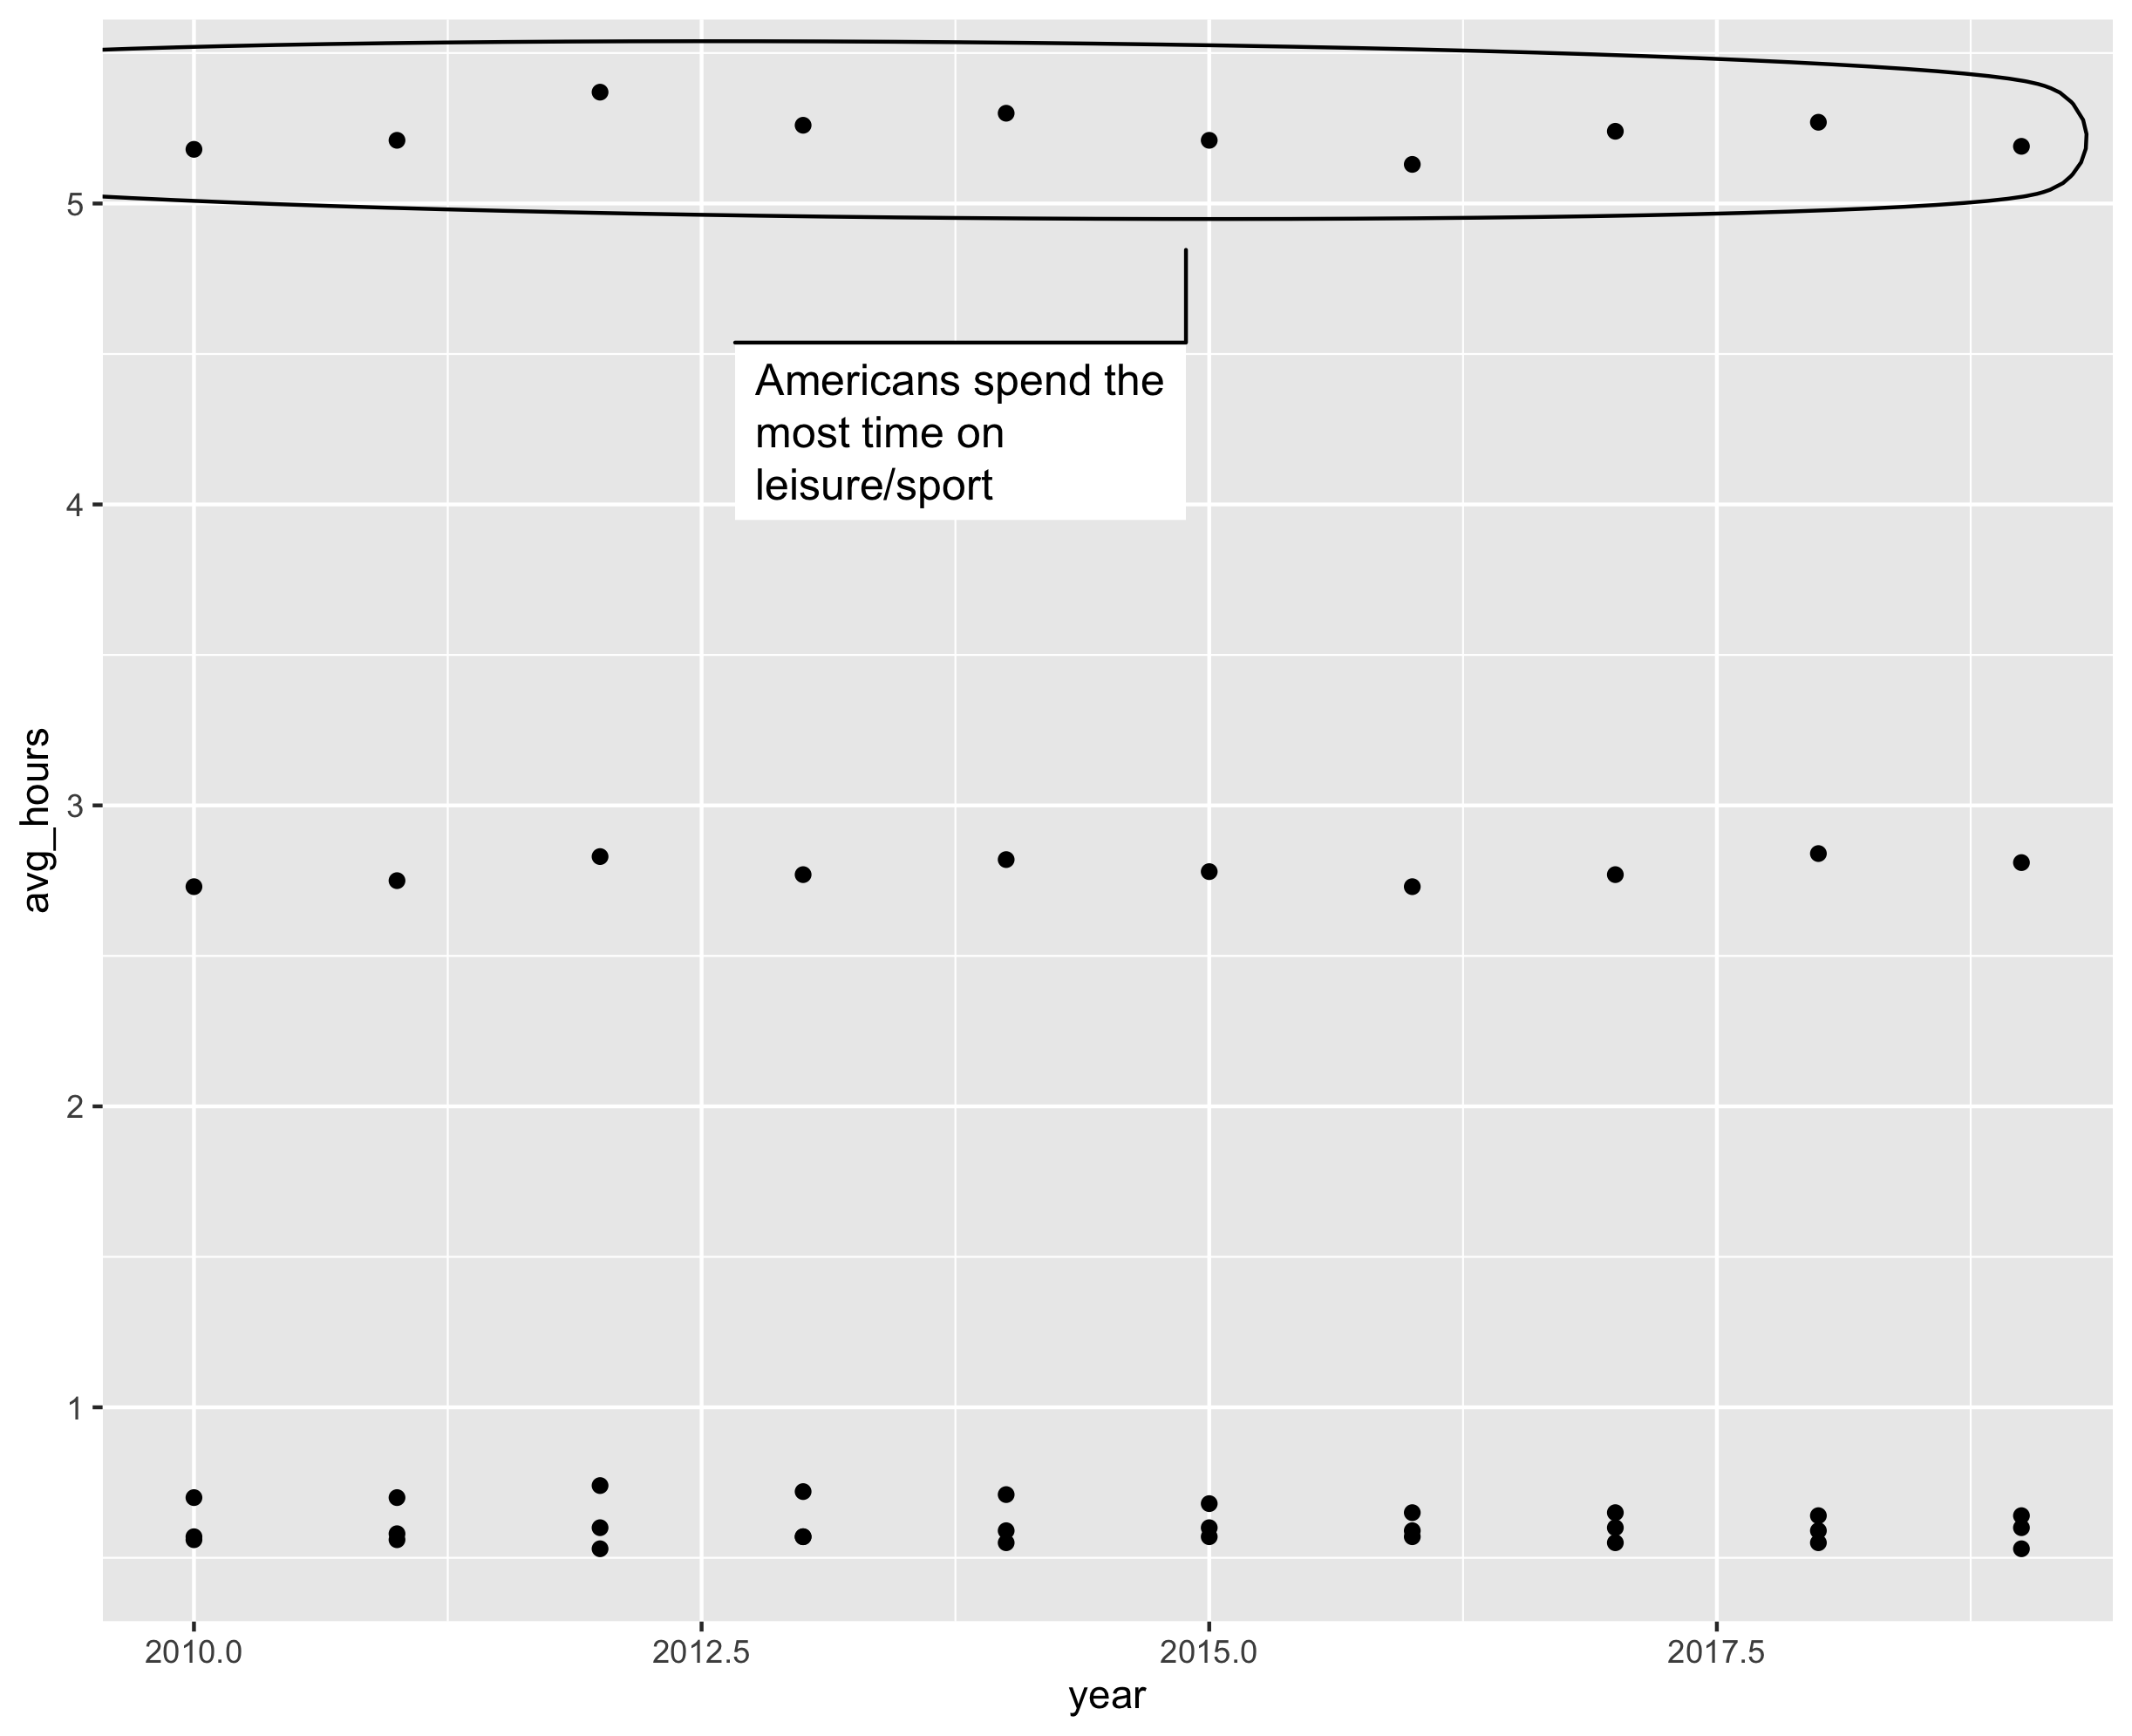
Exploratory analysis II
Data visualization, part 2. Code for Quiz 8.
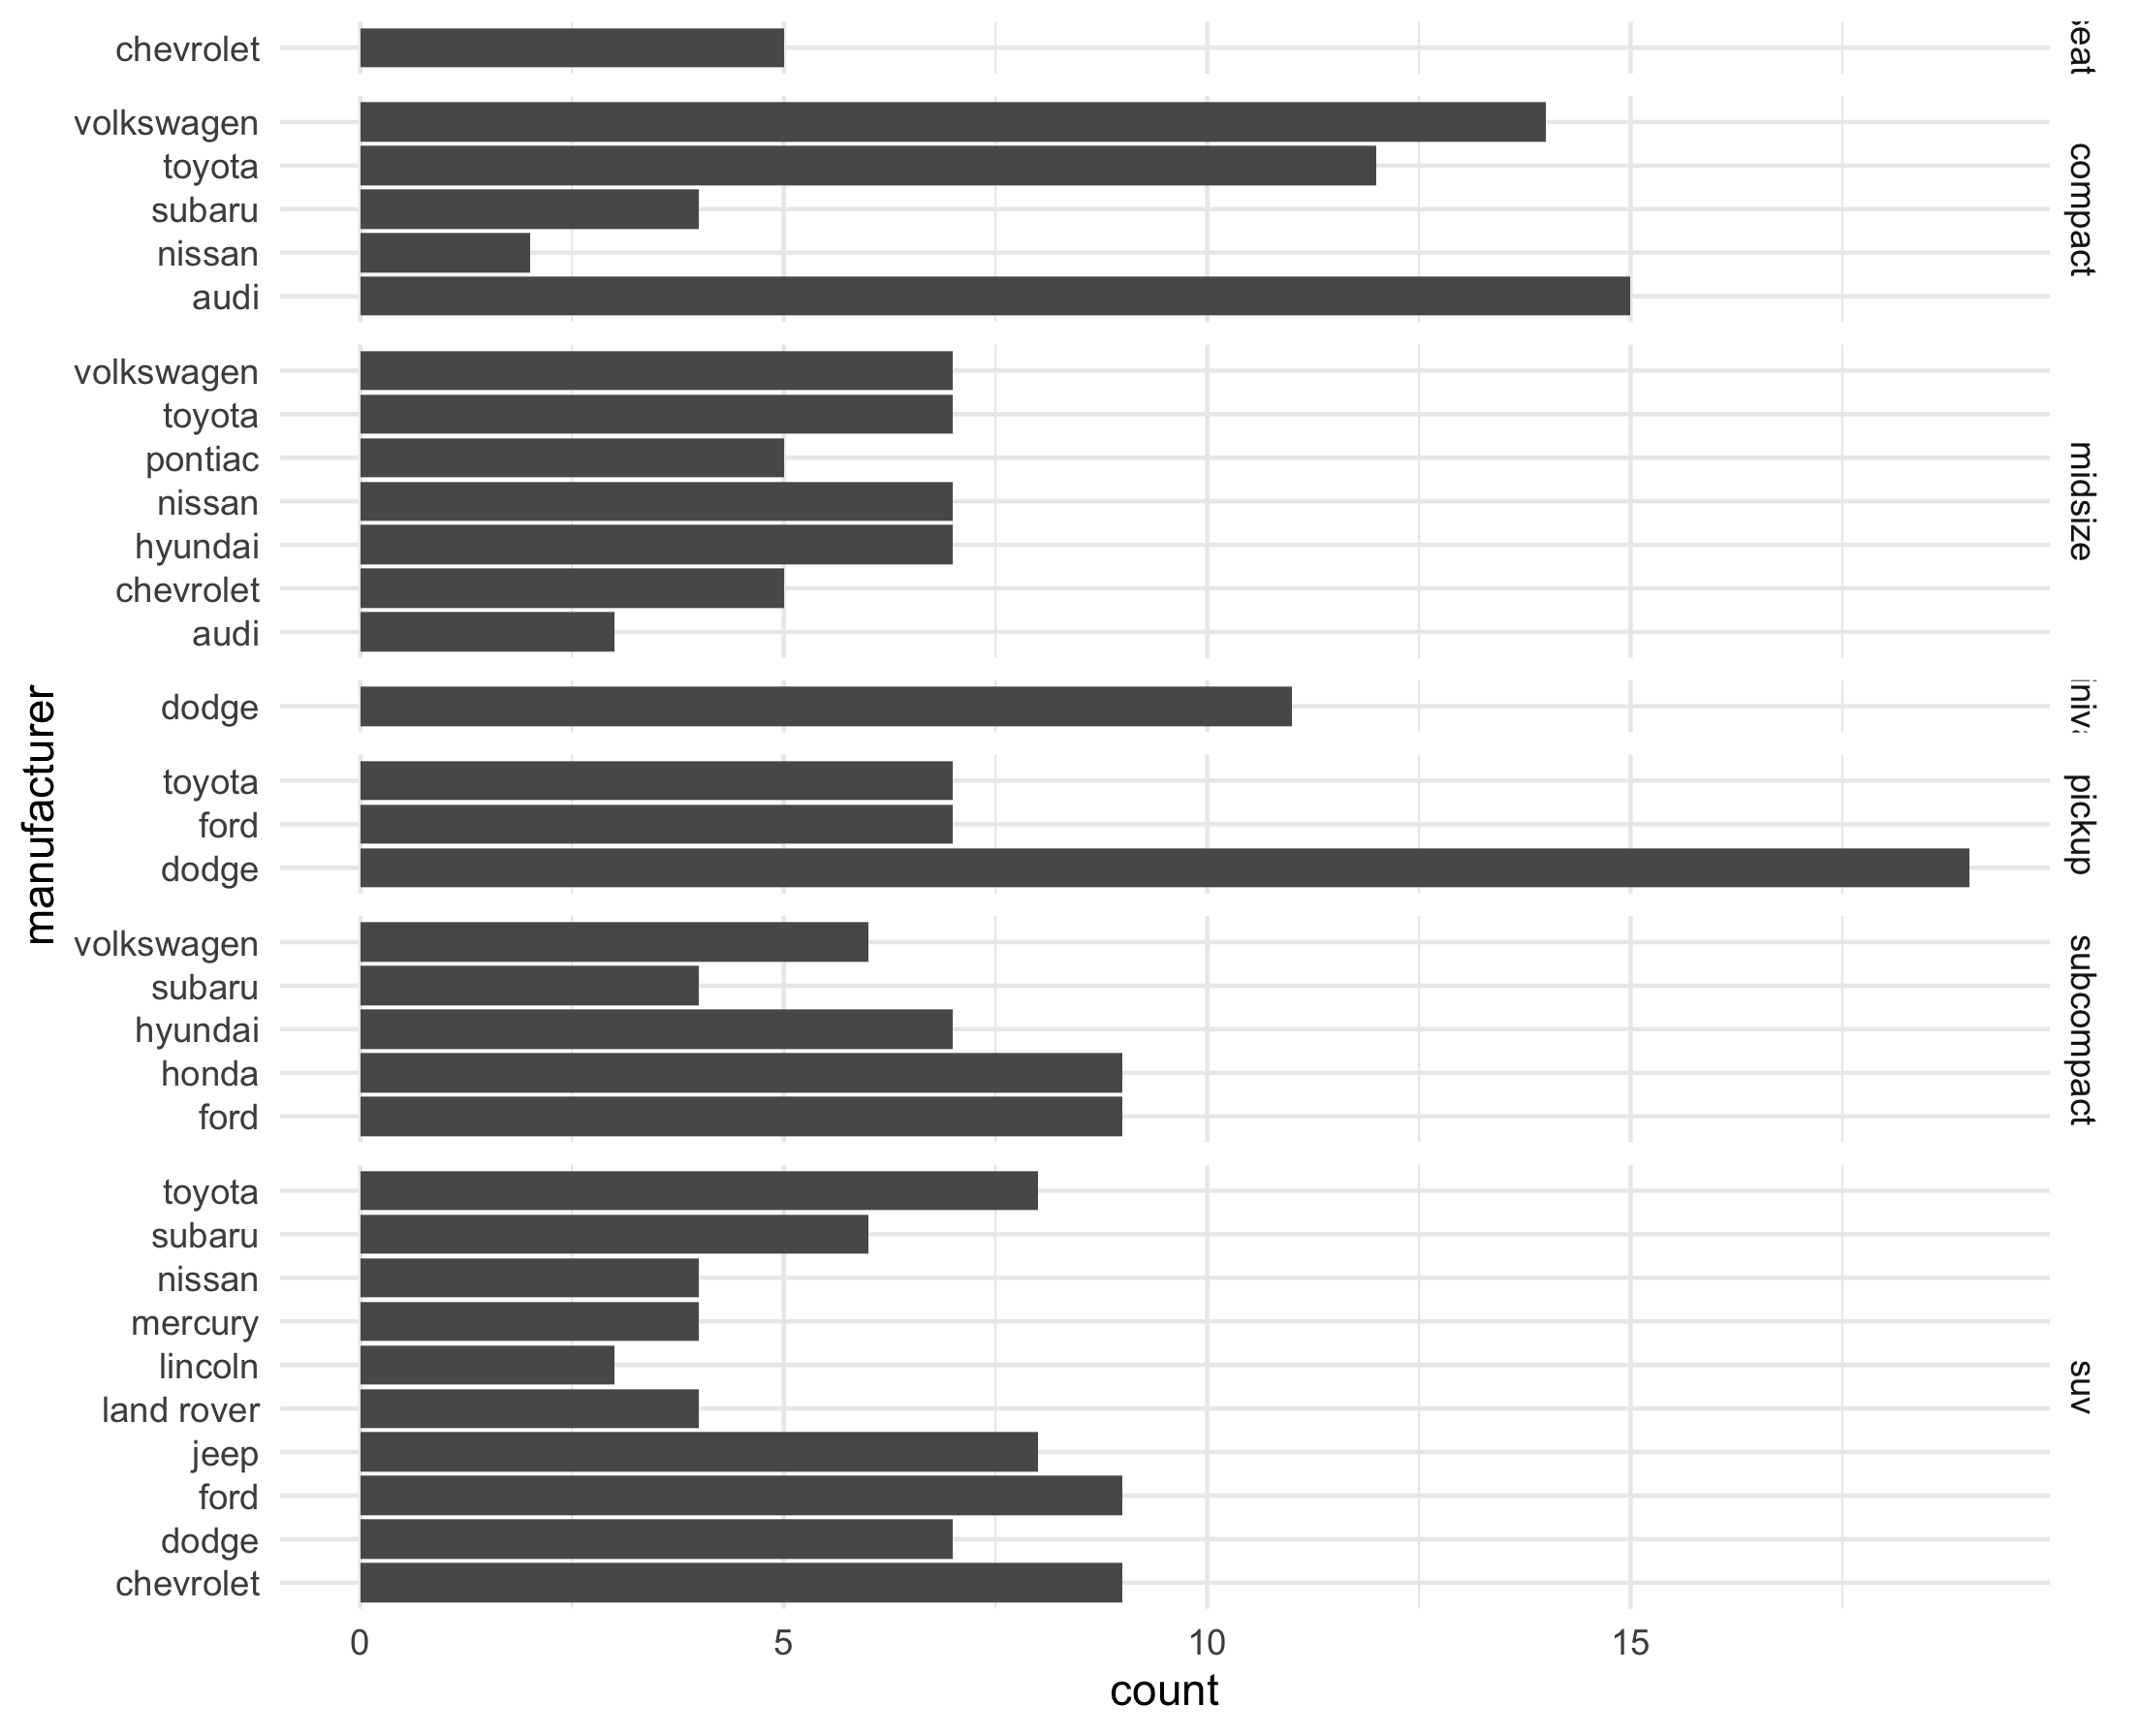
Exploratory analysis
Data visualization, part 1. Code for Quiz 7.
Joining Data
Code for Quiz 6, more dplyr and our firt interactive hart using echarts4f.
Data Manipulation
Code for Quiz 5. More practice with dplyr functions
Reading and writing data
In this section, we are learning how to translate, insert, and apply data into RStudio.
Introduction to dplyr
Code and text for Quiz 3.
Summary statistics
Comparison of R and Excel.