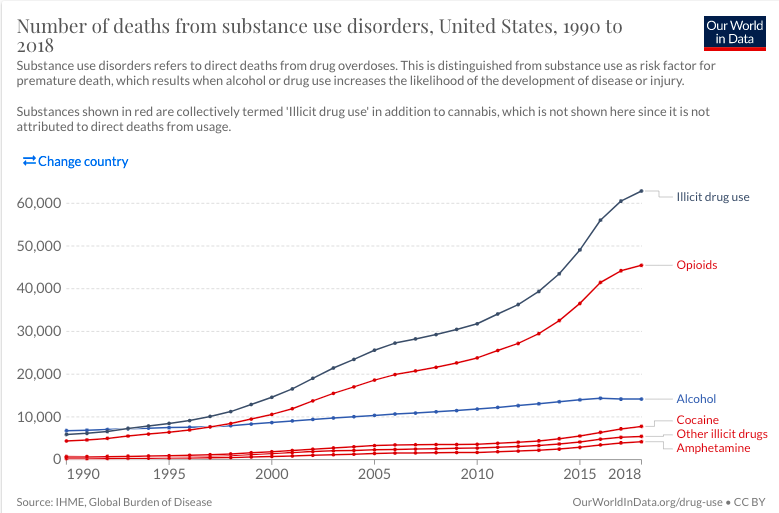
1.) I downloaded Deaths from Substance Disorders data from Our World in Data. I chose this data because substance abuse is becoming a very common way of life in our current society, and it shows what forms of drugs are hurting our communities.
2.) This is the link to the data.
3.) The following code chunk loads the package I will use to read in and prepared the data for analysis.
4.) Read the data in
5.) Use glimpse to see the names and types of the columns
glimpse(deaths_substance_disorders)
Rows: 6,840
Columns: 9
$ Entity                                                                    <chr> …
$ Code                                                                      <chr> …
$ Year                                                                      <dbl> …
$ `Deaths - Cocaine use disorders - Sex: Both - Age: All Ages (Number)`     <dbl> …
$ `Deaths - Drug use disorders - Sex: Both - Age: All Ages (Number)`        <dbl> …
$ `Deaths - Opioid use disorders - Sex: Both - Age: All Ages (Number)`      <dbl> …
$ `Deaths - Alcohol use disorders - Sex: Both - Age: All Ages (Number)`     <dbl> …
$ `Deaths - Other drug use disorders - Sex: Both - Age: All Ages (Number)`  <dbl> …
$ `Deaths - Amphetamine use disorders - Sex: Both - Age: All Ages (Number)` <dbl> …
# View(deaths_substance_disorders)
6.) Use output from glimpse (and View) to prepare the data for analysis
Use
filterto extract the rows I want to keep: Year %in% seq(1990, 2019, by = 5), Entity == “United States”.Change the name of the columns 4 to
Cocaine, 5 toOther_drugs, 6 toOpioid, 7 toAlcohol, and 9 toAmphetamineSelectthe columns to keep: Country, Year, Cocaine, Opioid, Alcohol, Amphetamine, and Other_drugsAssign the output to
deaths_per_drug
deaths_per_drug  <- deaths_substance_disorders %>%
  filter(Year %in% seq(1990, 2019, by = 5),
         Entity == "United States") %>%
  rename(Cocaine = 4, Other_Drugs = 5, Opioid = 6, Alcohol = 7, Amphetamine = 9) %>%
  select(Country =Entity, Year, Cocaine, Opioid, Alcohol, Amphetamine, Other_Drugs)

deaths_per_drug
# A tibble: 6 × 7
  Country        Year Cocaine Opioid Alcohol Amphetamine Other_Drugs
  <chr>         <dbl>   <dbl>  <dbl>   <dbl>       <dbl>       <dbl>
1 United States  1990     574   4352    6763         231        5865
2 United States  1995     918   6421    7484         348        8466
3 United States  2000    1856  10586    8666         720       14578
4 United States  2005    3269  18619   10356        1426       25614
5 United States  2010    3592  23816   11831        1694       31798
6 United States  2015    5517  36564   14005        2875       49086
7.) Add a picture of data
 [width = 100%]
8.) Write the data to file in the project directory
write_csv(deaths_per_drug, file = "deaths-substance-disorders.csv")